Memory as a capital-allocation constraint
How HBM, DRAM and NAND are rewriting the economics of AI data centers
Memory’s share of AI infrastructure is not a single number. The spread from roughly 3 percent to more than 75 percent is primarily a denominator-and-scope problem, amplified by architecture generation, price timing and whether HBM is bought inside an accelerator. What has changed is the role of memory itself: it is no longer a component cost that is priced after the GPU is chosen. It is becoming a constraint on how capital is allocated.
Central thesis
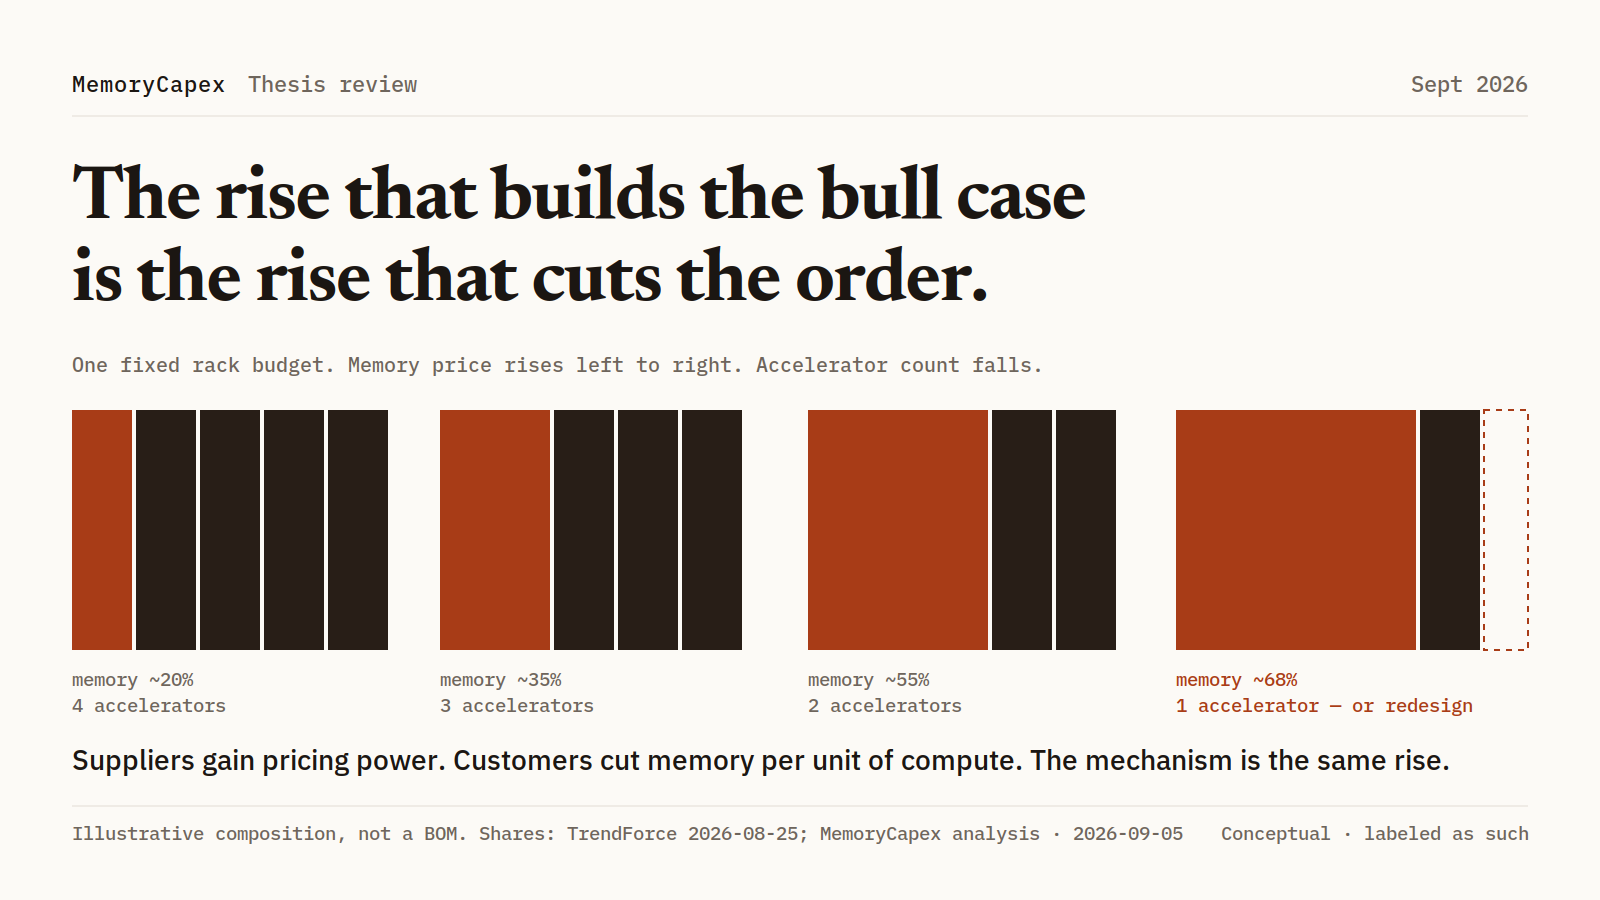
The differentiated claim is not that memory takes a larger share of CapEx. It is that the same rise creates an endogenous demand-destruction mechanism: suppliers gain pricing power, customers cut memory per unit of compute, and a realized 68 percent path is a late-cycle warning for the buyer’s program before it is a continuation of the supplier bull case.
Disclosure and editorial contract
This note is independent research. It is not a recommendation to buy or sell any security. MemoryCapex does not assume or disclose a trading position in the companies named below. Company names appear as a map of value-chain exposure, not as a ranking. Scenario weights are subjective and should be revised after the next supplier prints. Review date: 5 September 2026, America/Los_Angeles.
- Version: 1.1 EN publication draft — Gate review of 5 Sep 2026
- Primary numeric anchor: TrendForce, 25 Aug 2026: DRAM + NAND at 47% / 68% of major-CSP CapEx
- Base call: The constraint holds through 2027; the 68% path is conditional and, if printed, a warning
- Weights: base 45% / supplier bull 25% / demand destruction 20% / LTA-as-peak 10%
1. Three shares, not one number
Secondary coverage this week translated TrendForce’s 68 percent figure as “68 cents of every construction dollar.” That translation is wrong. Memory content share sits on an engineering bill of materials. Memory procurement share sits on a cloud provider’s treasury in a year of extreme contract prices. Memory revenue share sits on a supplier’s income statement. Treating those three objects as one number is how a cycle gets misread.
The deeper distinction is the one that should travel with this note. Dollar TAM can rise fast while bit demand grows slowly and the supplier profit pool does something else again. A high memory share of CapEx is not proof of rising physical memory intensity. It can be the opposite: fewer bits, much higher prices, and a customer already redesigning the rack.
The June 2026 Semiconductor Industry Association study with Deloitte finds that semiconductors account for more than 95 percent of the content value of a leading AI server rack and more than half of the capital required to build and operate an AI data center. Memory and storage — HBM, DRAM/SRAM and NAND in that report — account for more than 20 percent of the rack’s semiconductor content value. The accelerator alone takes more than 70 percent of semiconductor content, and HBM is typically embedded in the accelerator price rather than purchased as a separate line item.
That last point is an accounting problem as much as a market problem. If HBM is counted inside GPU cost and again inside “memory,” the memory share is double-counted. If it is counted only inside the GPU, the memory industry’s economic role is understated. MemoryCapex’s rule is simple: for supplier economics, HBM is always memory; for a CSP budget, HBM is often bought inside a NVIDIA or ASIC system.
2. The denominator-and-scope problem
An earlier draft used “$15 of every $100” as a narrative hook without deriving it. That hook is gone. What remains is six named objects. They do not share a numerator. Google’s figure is high-performance memory on a server hardware BOM. TrendForce is DRAM plus NAND on a CSP treasury. Bernstein’s mid-2026 rack figure is memory plus storage. SIA/Deloitte is a semiconductor-content teardown. Putting those percentages on one axis invites a comparison the data do not support.
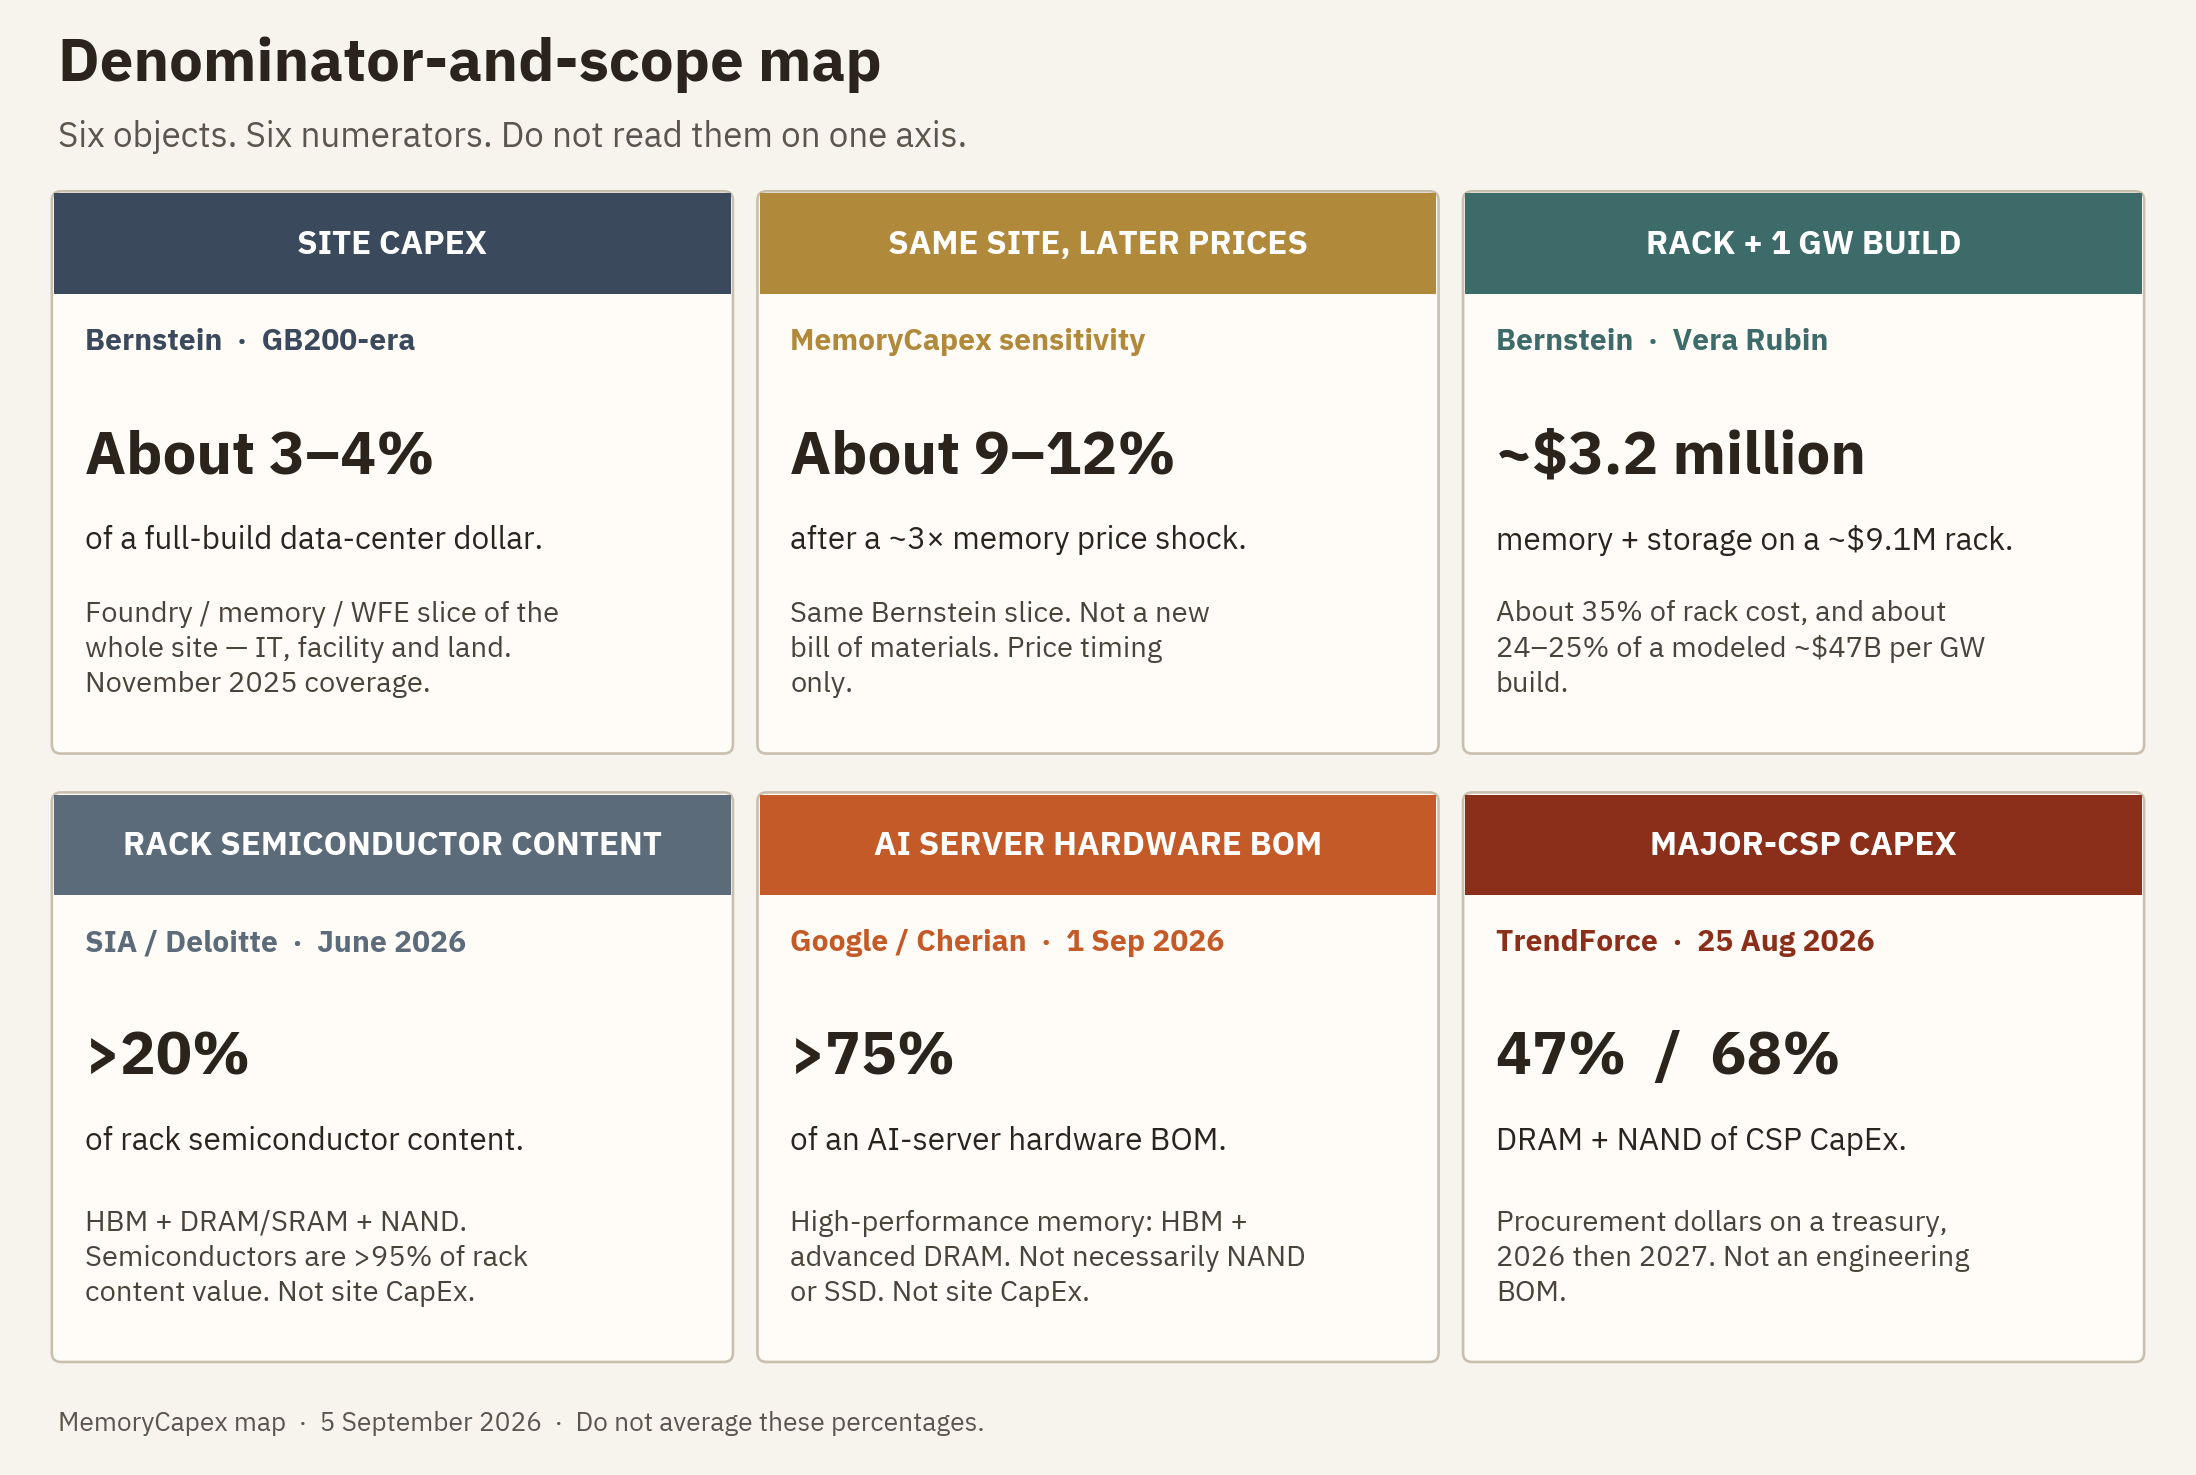
Figure 1. Denominator-and-scope map. Each card is a different object. Do not average the percentages. Review date 5 September 2026.
- Bernstein, GB200-era full build (Nov 2025 coverage): about 3–4% of full data-center CapEx; approximately US$1.0–1.2B per GW. Product scope: foundry / memory / WFE slice of the site. Source layer: secondary sell-side. Measures the entire site: IT, facility and land.
- Same slice after approximately 3× memory prices: about 9–12%. Same memory slice; later prices. MemoryCapex sensitivity. A price shock, not a new BOM.
- Bernstein Vera Rubin note, mid-2026: approximately US$3.2M of a US$9.1M rack, or about 35% of rack; about 24–25% of a modeled US$47B per GW build. Product scope: memory + storage. Secondary sell-side. Rack cost versus a full 1 GW stack.
- SIA / Deloitte, June 2026: more than 20% of rack semiconductor content. Product scope: HBM, DRAM/SRAM and NAND. Primary industry study. Semiconductor content of a rack, not the site.
- Google / Nikhil Cherian, 1 Sep 2026: more than 75% of an AI server hardware BOM. Product scope: high-performance memory — HBM + advanced DRAM, not necessarily NAND/SSD. Primary hyperscaler source at SEMICON Taiwan. Server hardware BOM, not rack or site CapEx.
- Deloitte, 28 Jul 2026, citing SemiAnalysis Apr 2026: approximately 30% in 2026 / 36% in 2027. Hyperscaler investment definition; tertiary path. Hyperscaler data-center investment.
- TrendForce, 25 Aug 2026: 47% in 2026 / 68% in 2027. Product scope: DRAM + NAND. Primary market-research note. Share of major-CSP CapEx.
Table 1. The Deloitte / SemiAnalysis row is labeled tertiary on purpose. A separate Morgan Stanley rack-BOM figure circulating through third-party reprints is omitted for the same reason.
Google’s SEMICON Taiwan 2026 remark is the new primary-source layer. Nikhil Cherian, senior director of supply-chain infrastructure at Google Cloud, said multimodal and mixture-of-experts architectures have pushed AI computing from compute-bound to memory-bound, and that high-performance memory now accounts for more than 75 percent of an AI server’s hardware BOM. The official presentation page carries the same figure. That is not a confirmation of TrendForce’s 68 percent of CSP CapEx. It is confirmation that, on a server BOM, HBM and advanced DRAM can already dominate.
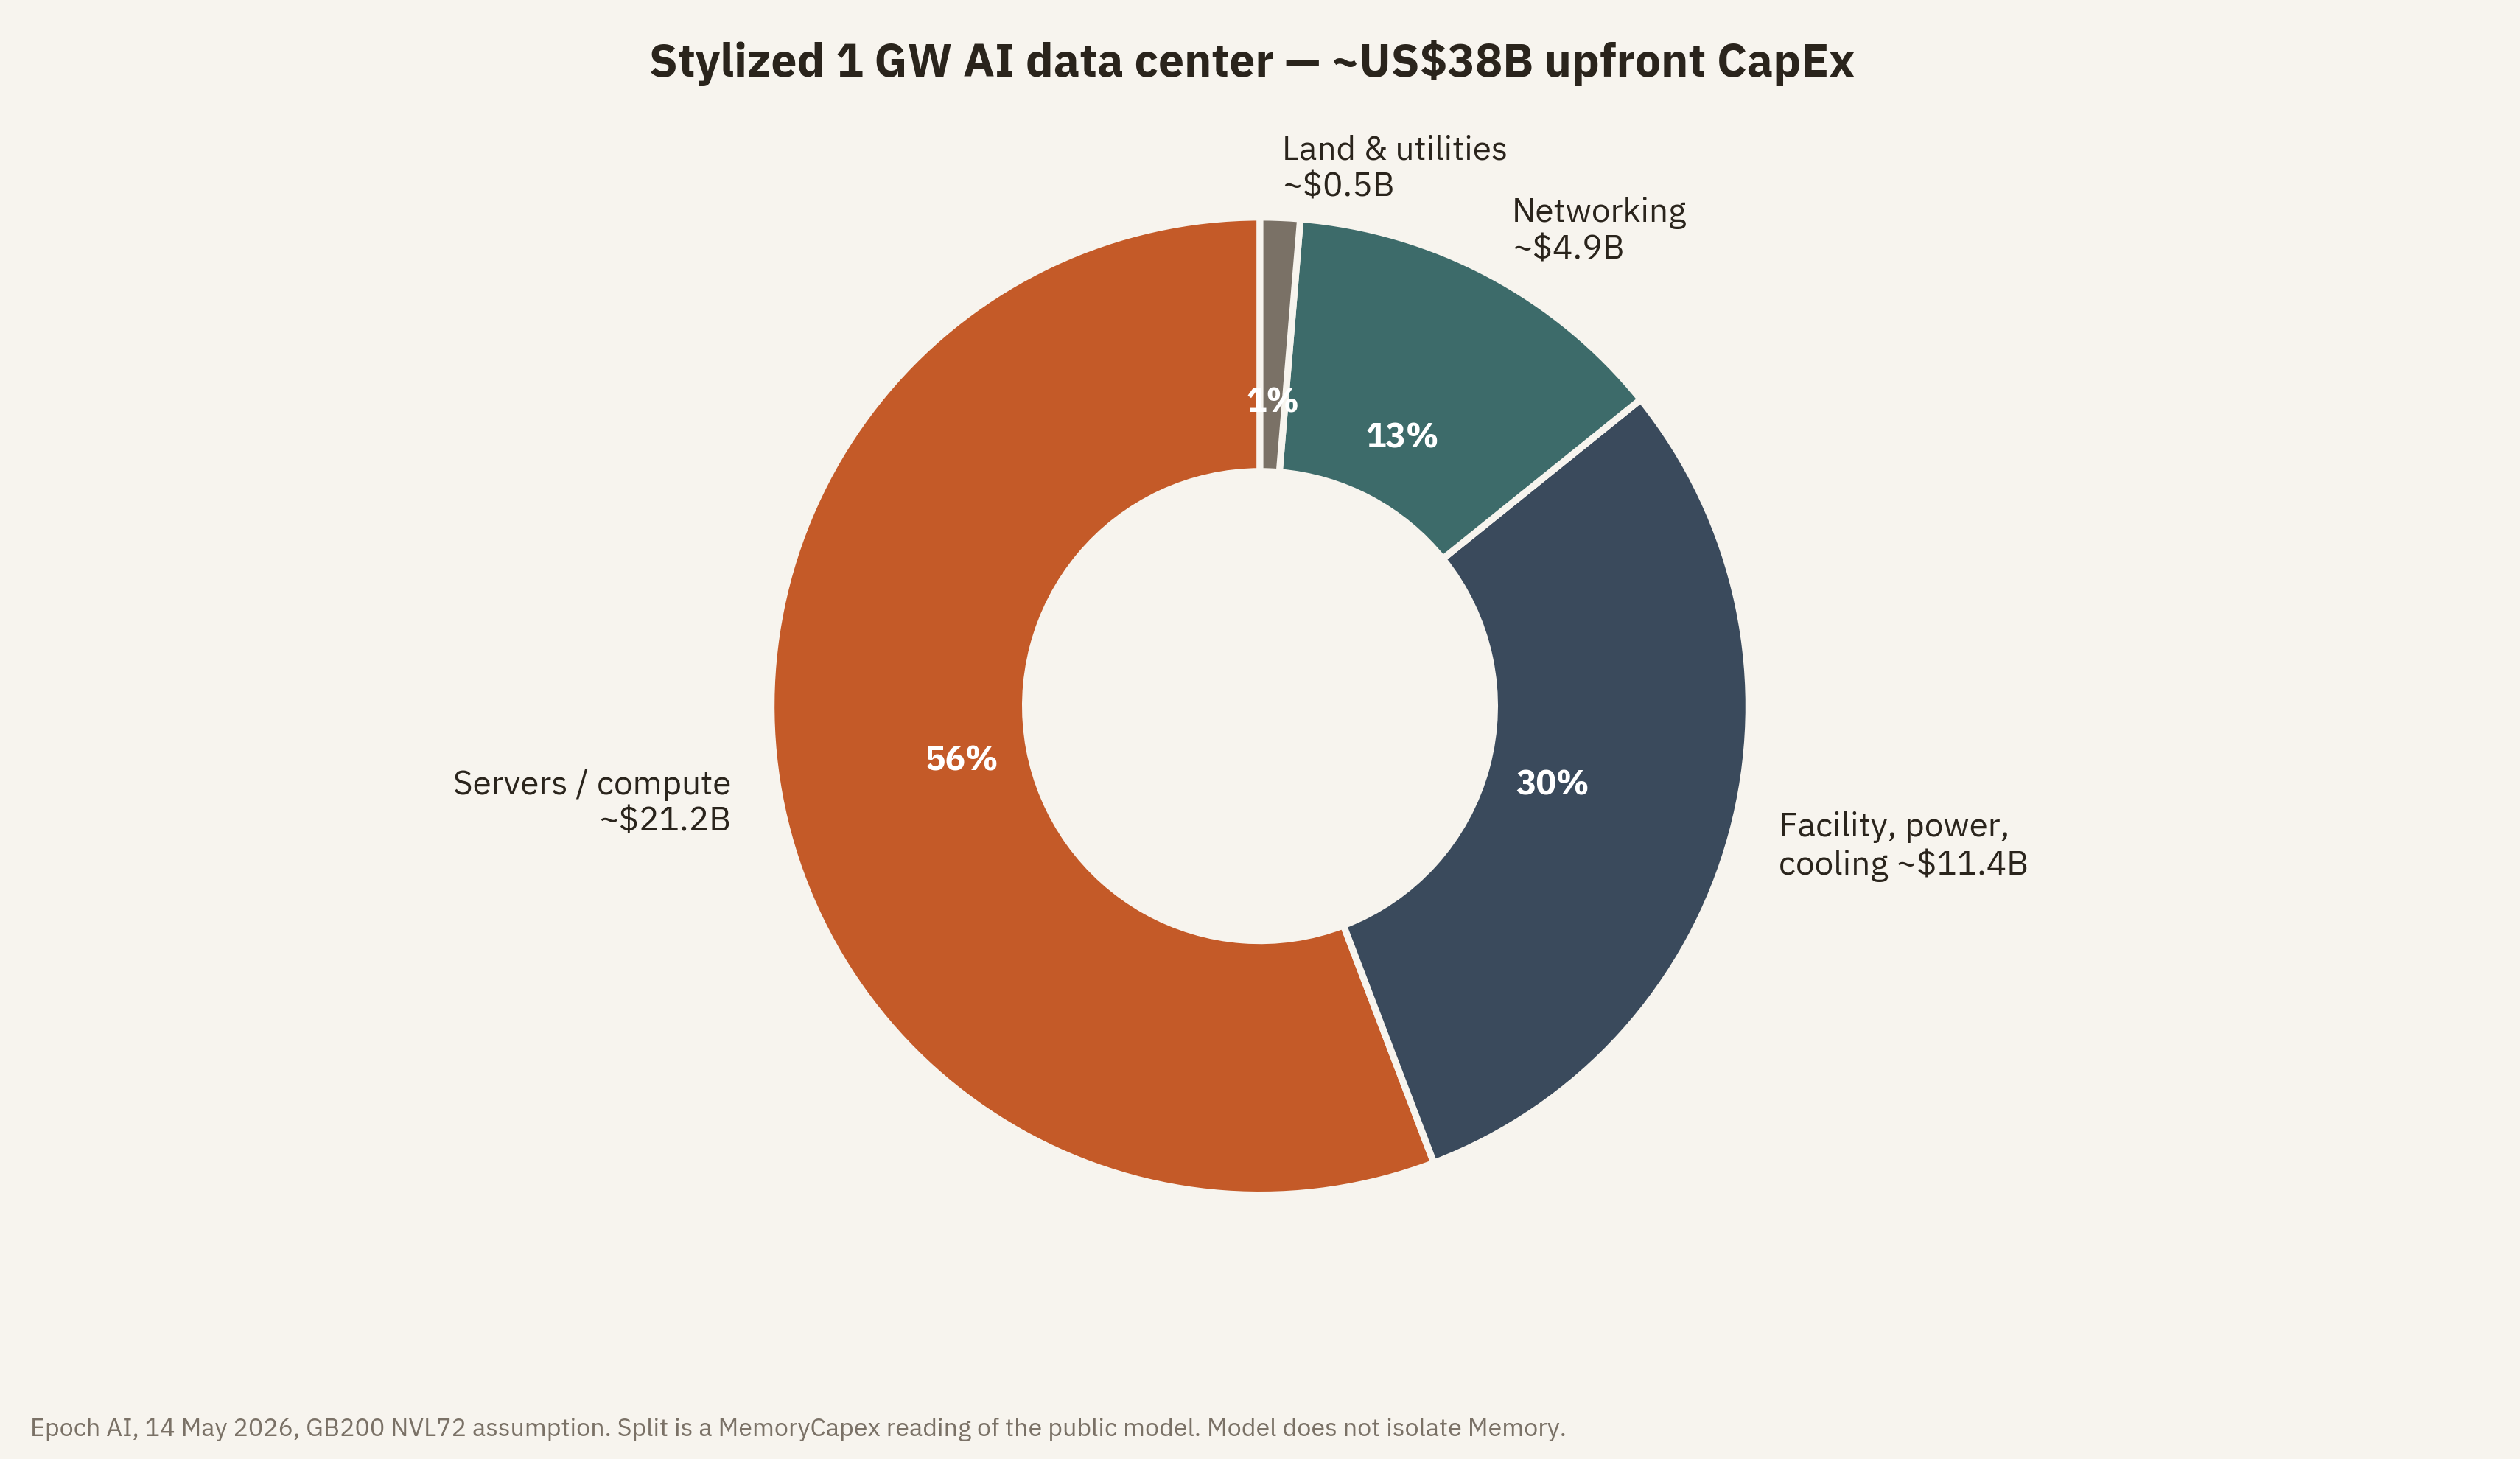
Figure 2. Epoch AI’s stylized 1 GW model (14 May 2026) puts upfront CapEx near US$38B and annualized TCO near US$8.5B, of which servers are about US$5B and energy about US$0.6B. The split is a MemoryCapex reading of the public model. The model does not isolate memory and should not be forced to.
3. The TrendForce identity that has to sit on the page
If the 25 August TrendForce claims are taken together, and if the CSP universe and CapEx definition are held constant, the arithmetic is not optional. Let major-CSP CapEx in 2026 equal C. Memory spending in 2026 is 0.47C. CapEx in 2027 is 1.50C. Memory spending in 2027 is 0.68 × 1.50C, or 1.02C. The 2027 memory-dollar pool is therefore about 2.17 times the 2026 pool — a 117 percent increase. Under those assumptions, 2027 memory dollars roughly equal all of 2026 major-CSP CapEx.
The same note says combined server DRAM and HBM bit supply grows about 27 percent in 2027. That 27 percent and the 117 percent dollar increase do not share a universe: one is server DRAM plus HBM bits, the other is DRAM plus NAND dollars. A blended ASP cannot be recovered from those two published scopes. What can be said is narrower and still useful. A 68 percent path requires a very large price-and-mix contribution on top of bit growth. If long-term agreements cap server DRAM and NAND loosens in the second half of 2027, as TrendForce itself sketches, the 68 percent path is internally strained.
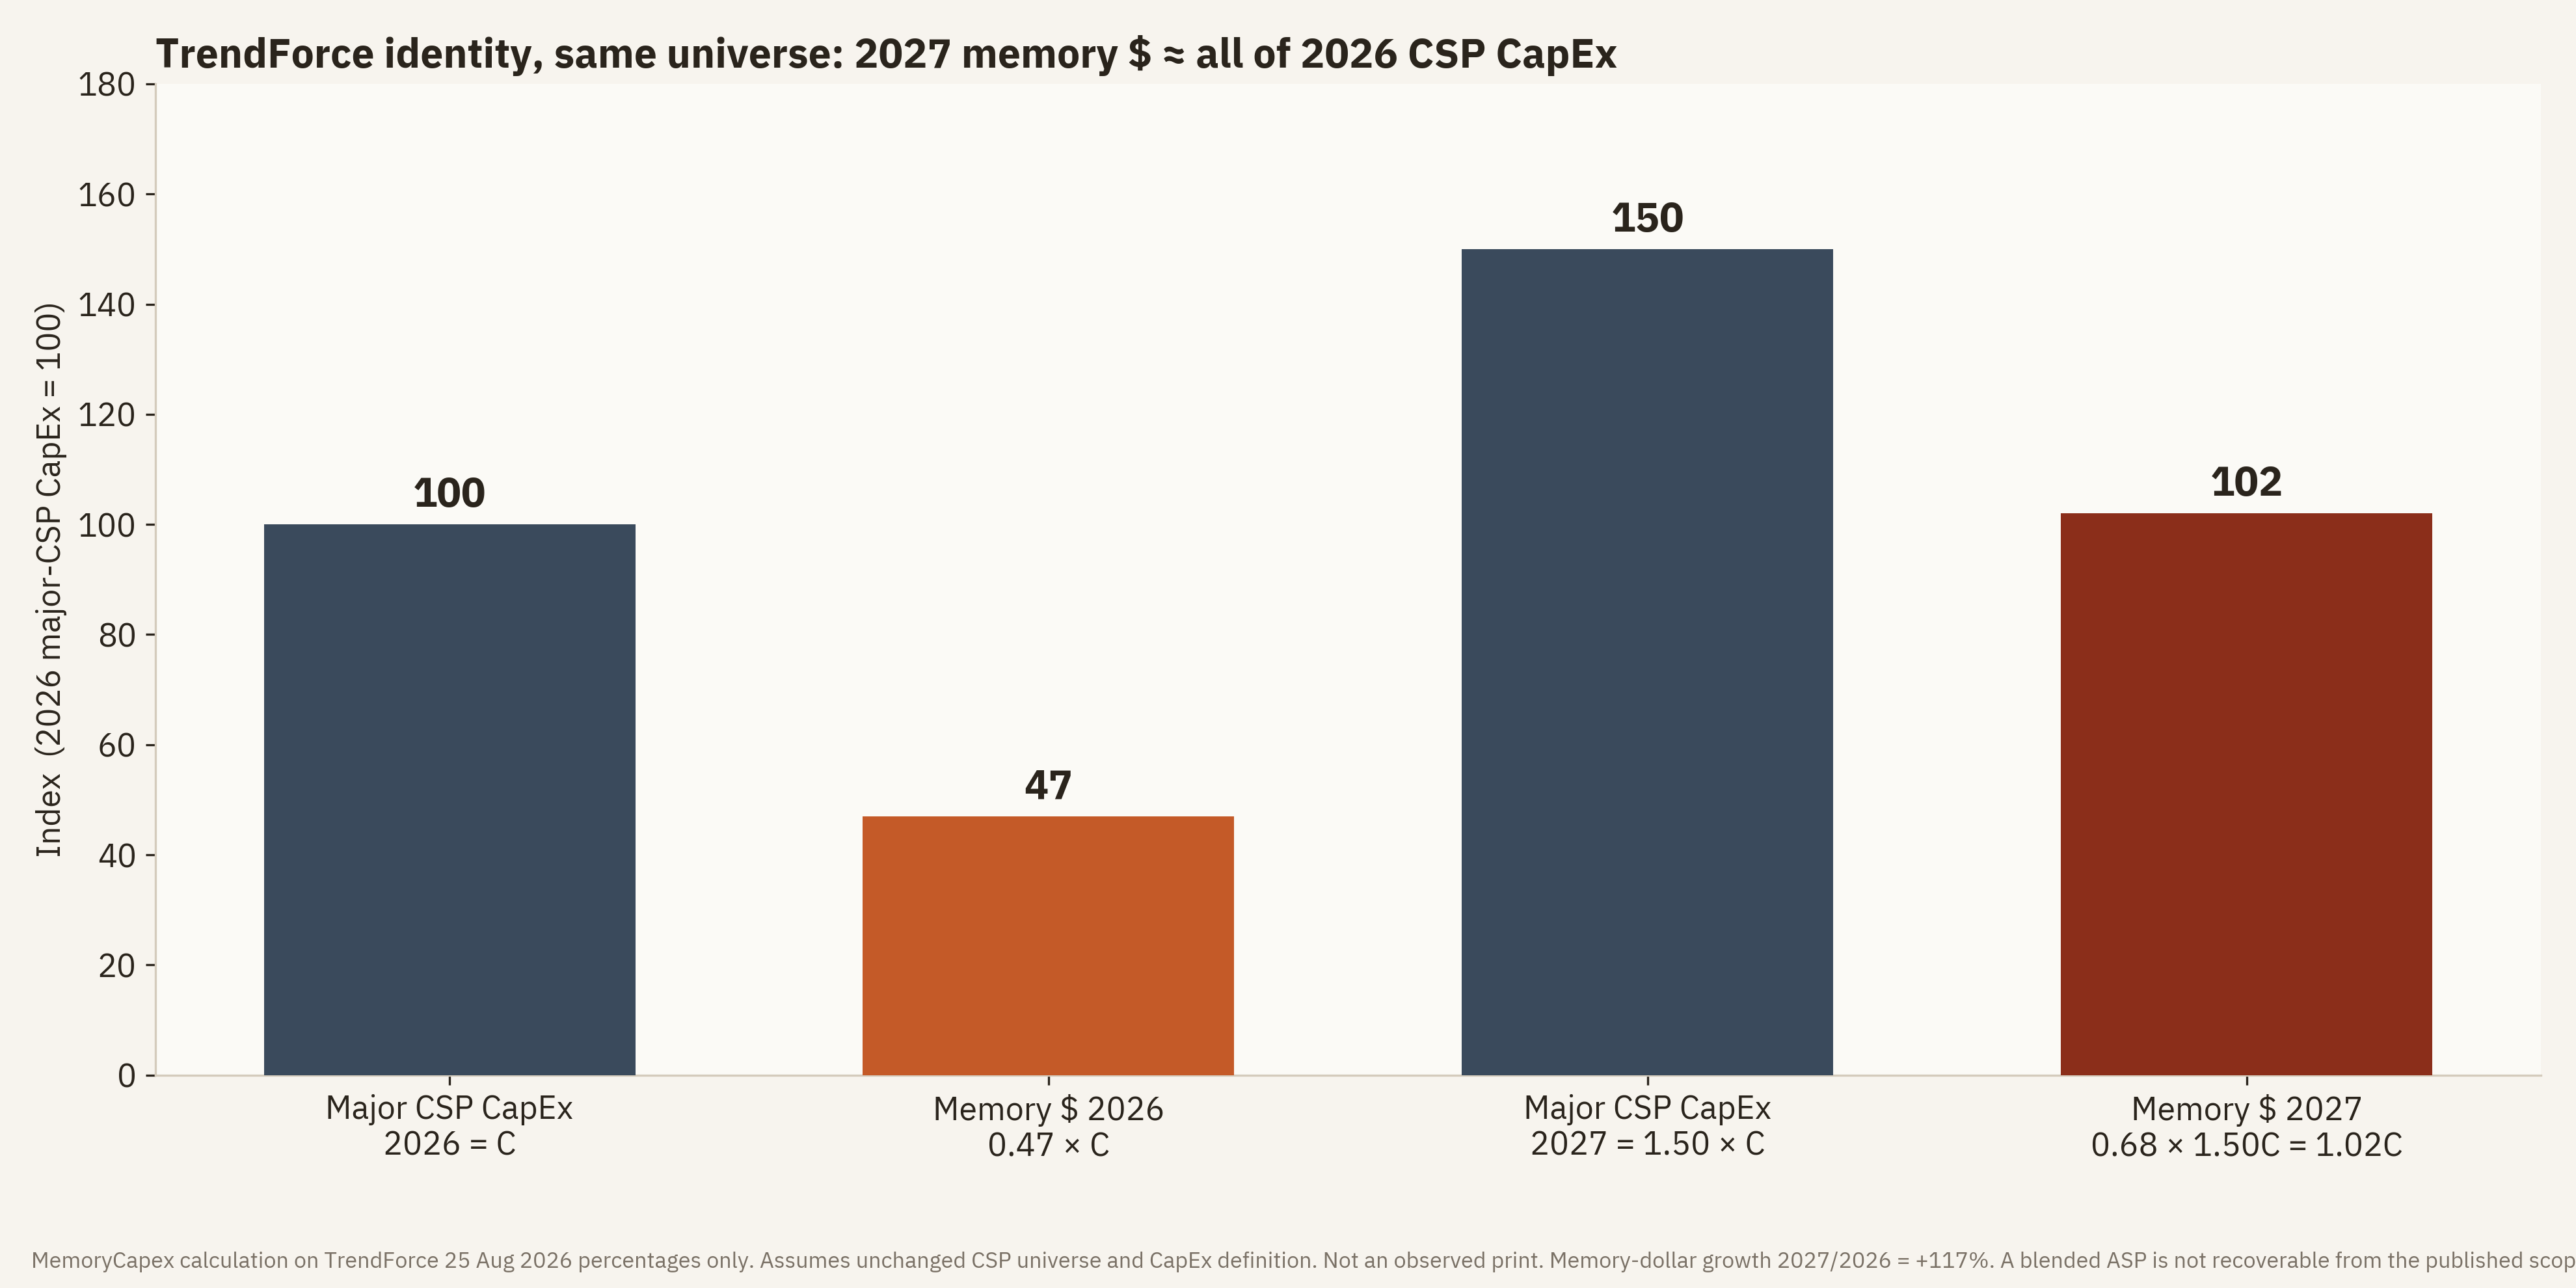
Figure 3. MemoryCapex calculation on TrendForce’s published percentages only, assuming an unchanged CSP universe and CapEx definition. This is a scenario identity, not an observed print.
Some CSPs already reported negative free cash flow in 2026. A memory bill the size of last year’s entire capital budget is not only a supplier windfall. If it prints, it is a late-cycle warning for the buyer’s program. That is the investment reading of 68 percent: not “the bull case continues,” but “the buyer’s constraint is now visible in the budget.”
4. Cycle Call Ledger
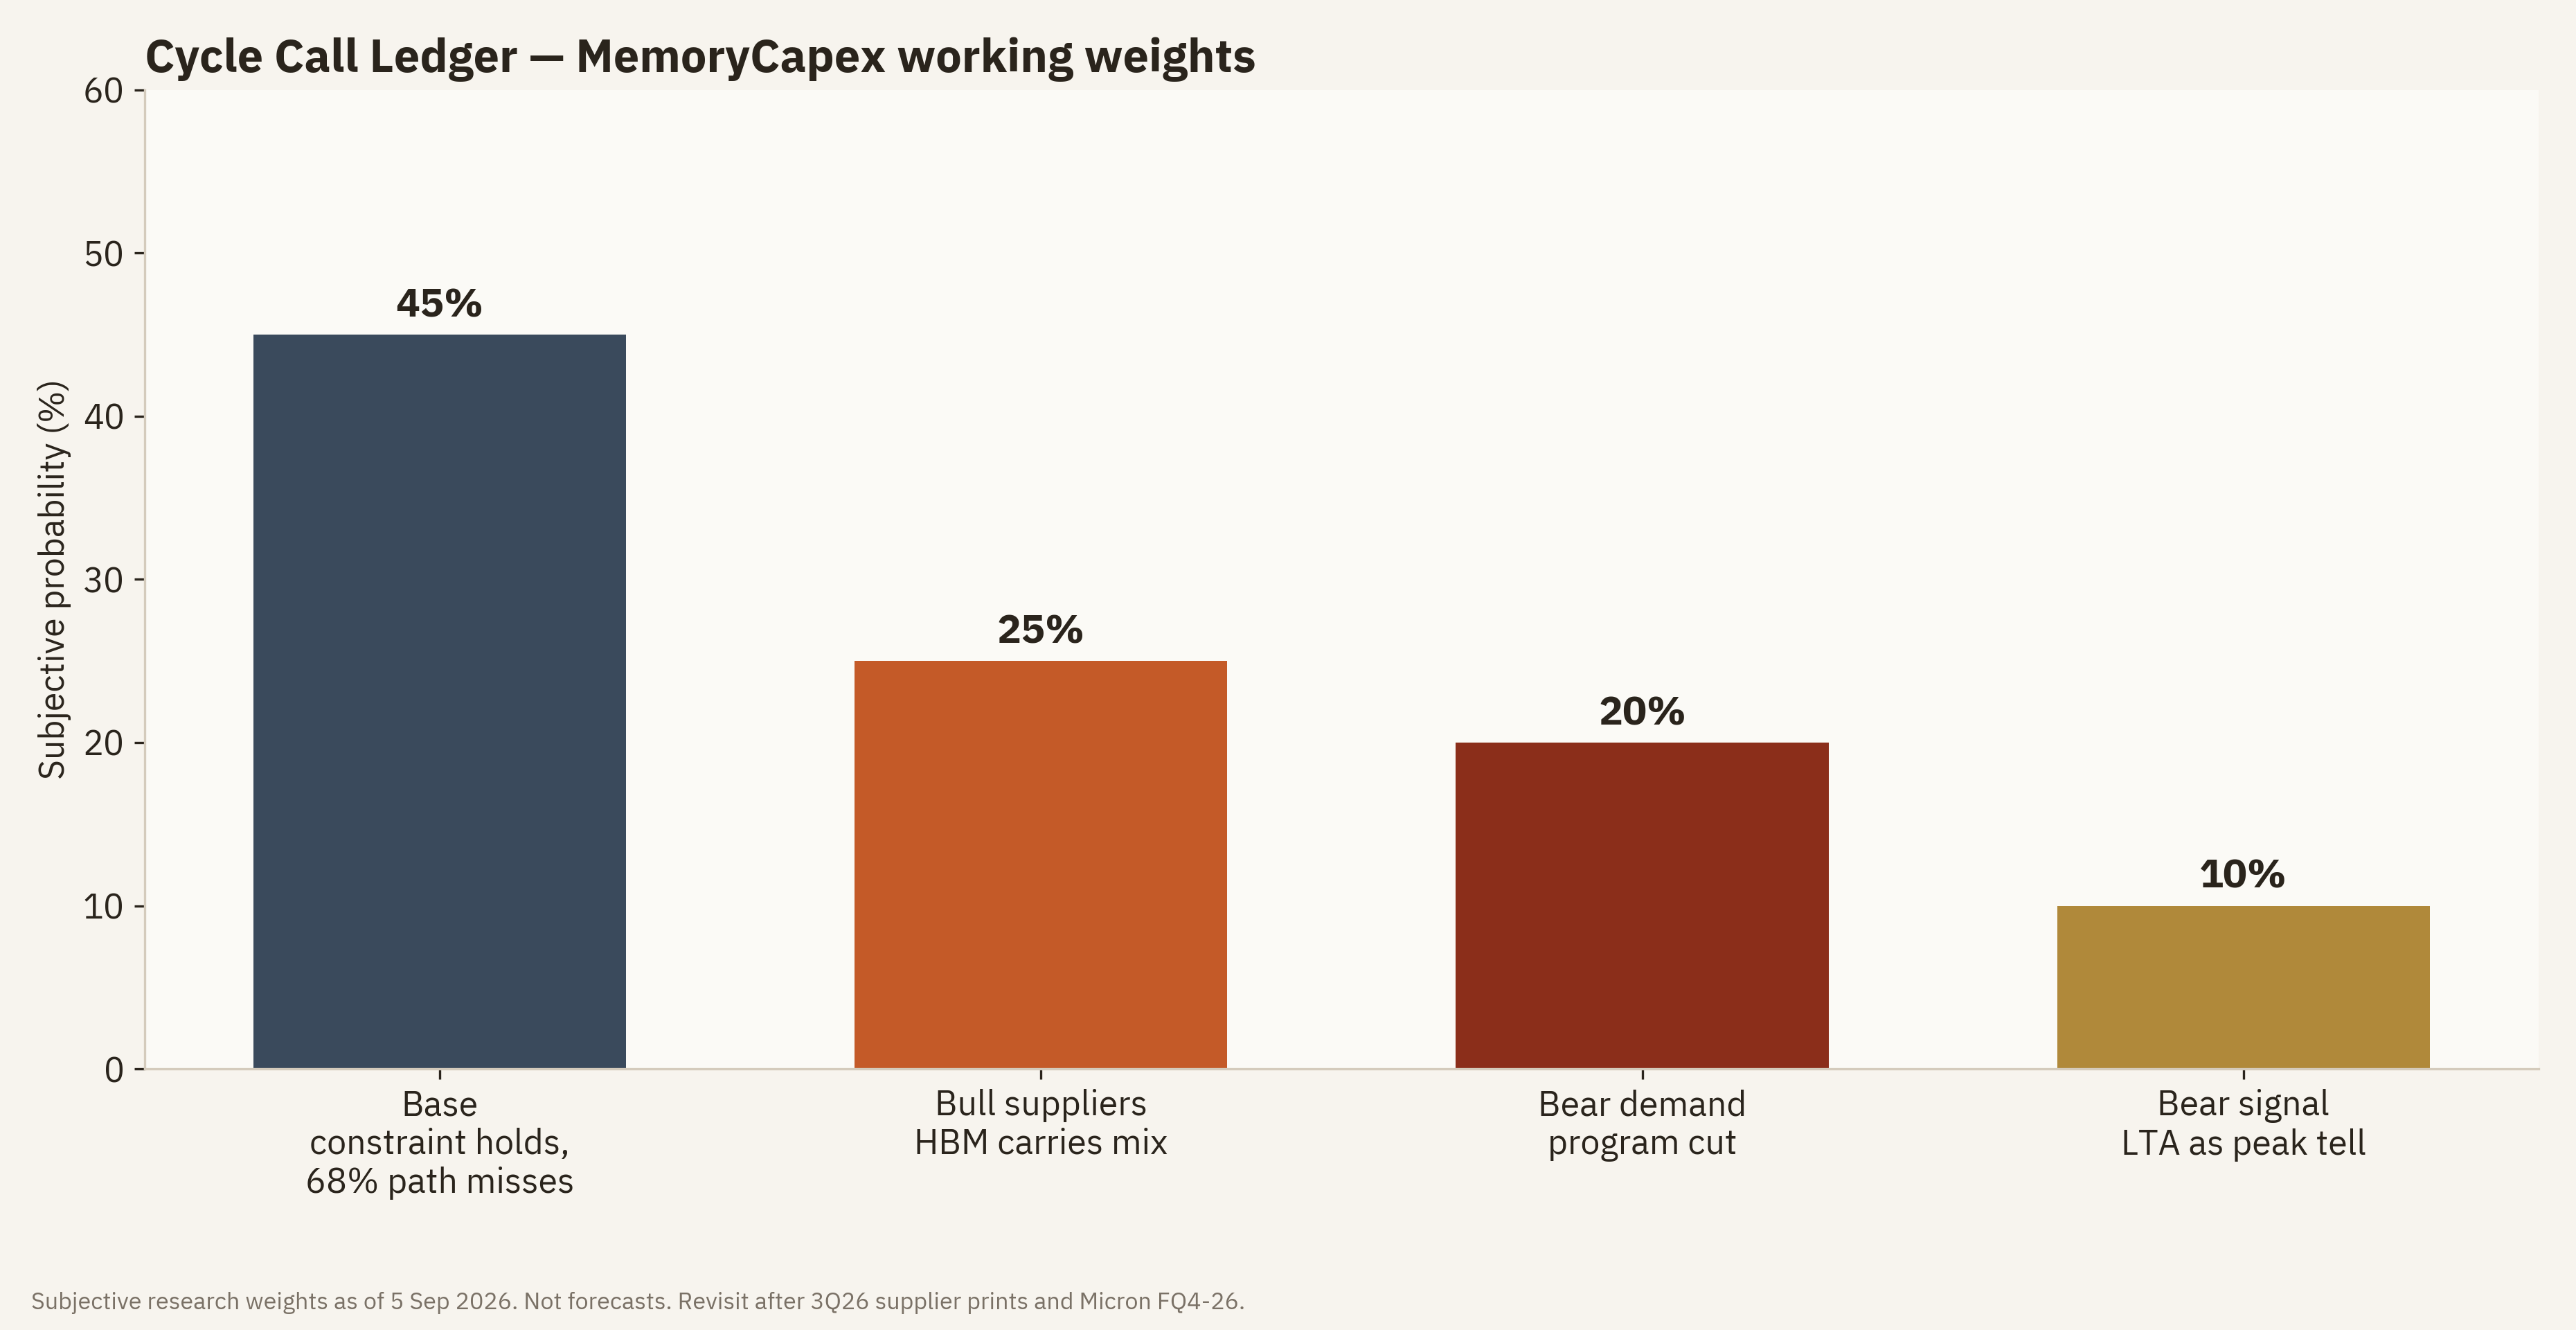
Figure 4. Subjective working weights as of 5 September 2026. Revisit after 3Q26 supplier results and Micron’s fiscal fourth quarter.
- Base: constraint holds; 68% path misses — 45%. What should be visible: DRAM tight through 2027; NAND eases from 2H27; CSP CapEx still up but slower; blended memory share rolls off the peak. Falsifier: a 2027 CSP-share print above 65% with NAND still tight.
- Supplier bull: HBM carries mix — 25%. What should be visible: 2027 HBM contracts land in the upper half of +70–140%; HBM profit per wafer reclaims the lead over RDIMM. Falsifier: failed HBM4 talks, or supplier margins falling without a mix explanation.
- Demand destruction: redesign becomes a pause — 20%. What should be visible: two consecutive cuts in hyperscaler CapEx guidance, or a drop in AI-rack orders. Falsifier: CapEx growth holds even with elevated memory prices.
- LTA as a peak tell — 10%. What should be visible: ceilings arrive with weaker floors, thinner volume commitments, or shorter tenors. Falsifier: LTA renewals reset floors higher, not ceilings.
5. Three memory economies
HBM
HBM sits next to the accelerator. Its job is bandwidth, not cheap capacity. TrendForce estimates that HBM will take about 18, 22 and 30 percent of the three major suppliers’ DRAM wafer input at year-end 2025, 2026 and 2027, while producing only about 8, 9 and 13 percent of DRAM bits. At Hot Chips 2026, Micron said the combined overhead of architecture, packaging and manufacturing means HBM3E consumes about three times as much silicon as DDR5 for the same capacity. That comparison is wafer area and resources per equivalent capacity. It is not a packaging-cost or finished-product-cost multiple. The point was restated in 2026, not only in 2024 commentary.
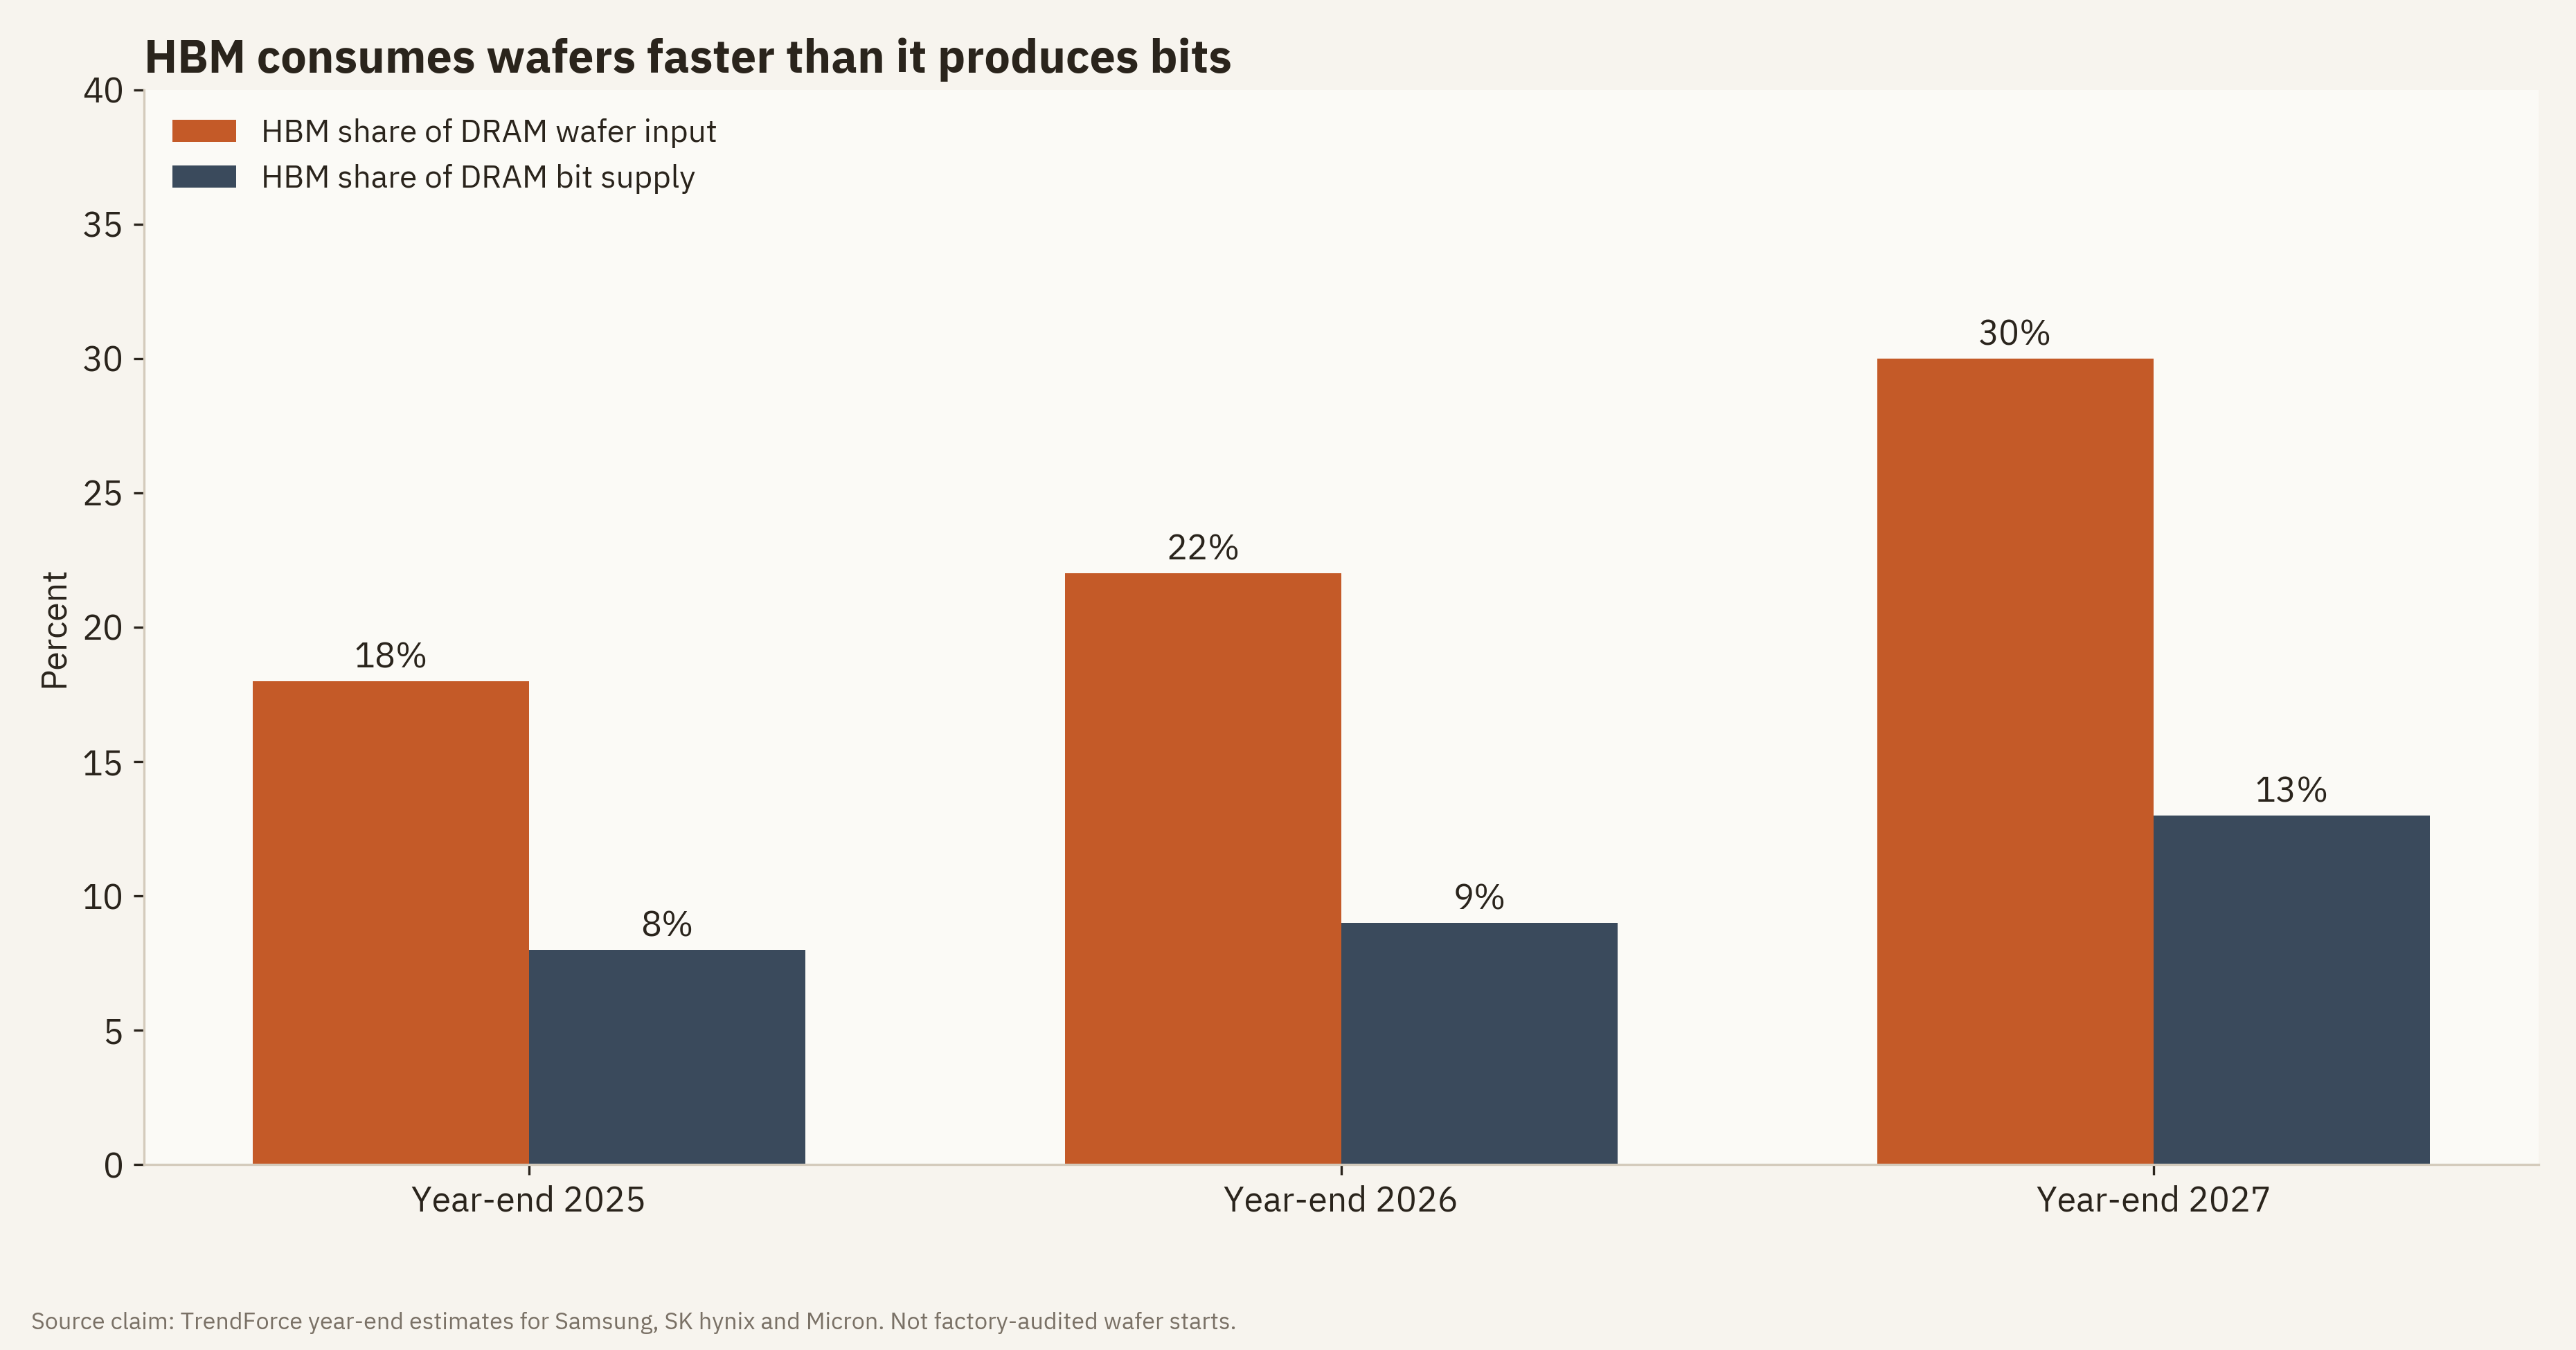
Figure 5. Source claim: TrendForce year-end estimates for Samsung, SK hynix and Micron. Not factory-audited wafer starts.
From early 3Q26, TrendForce says NVIDIA has been evaluating Rubin Ultra HBM options beyond the original 12-Hi HBM4e baseline: 8-Hi HBM4e, 12-Hi HBM4 and 8-Hi HBM4. The final specification has not been set. TrendForce also says the generation’s primary objective is higher I/O speed; raising GPU shipment volume is secondary. If NVIDIA cuts stack height, that is not only a supply workaround. It is a strategic choice between next-generation I/O and the number of GPUs that can be built from scarce wafers. Secondary reports have circulated a 192 GB SKU figure. MemoryCapex has not independently verified the originating desk and does not put that number in the main table.
In 1H26, some CSPs and server OEMs cut RDIMM mixes from 96 GB or 128 GB modules toward 32 GB or 64 GB. NVIDIA halved SOCAMM capacity on Vera Rubin Superchip modules after judging that LPDDR5X tightness is likely to last through 2027.
System DRAM
TrendForce estimates that HBM and RDIMM together absorb about 51 percent of DRAM bit supply in 2026. Dell Technologies chief operating officer Jeff Clarke, on the company’s recent earnings call, described the constraint as “DRAM, DRAM, DRAM, followed by NAND, NAND, NAND.” The quote is from coverage of that call in early September 2026. AI is pressing DRAM from both sides: direct HBM demand rises, and the wafer pool left for conventional server DRAM shrinks.
NAND and enterprise SSD
On 1 September 2026 TrendForce put top-five enterprise SSD revenue at US$37.59 billion in 2Q26, up 103.6 percent quarter on quarter. Samsung US$14.35 billion; SK hynix Group US$8.63 billion; Micron US$6.98 billion; Kioxia US$4.64 billion; SanDisk US$2.98 billion. Micron grew 126.3 percent, the fastest of the five. The same research house expects DRAM to stay tight in 2027 while NAND likely eases in the second half as new capacity arrives. The combined 47 / 68 percent figure should not be read as one cycle.
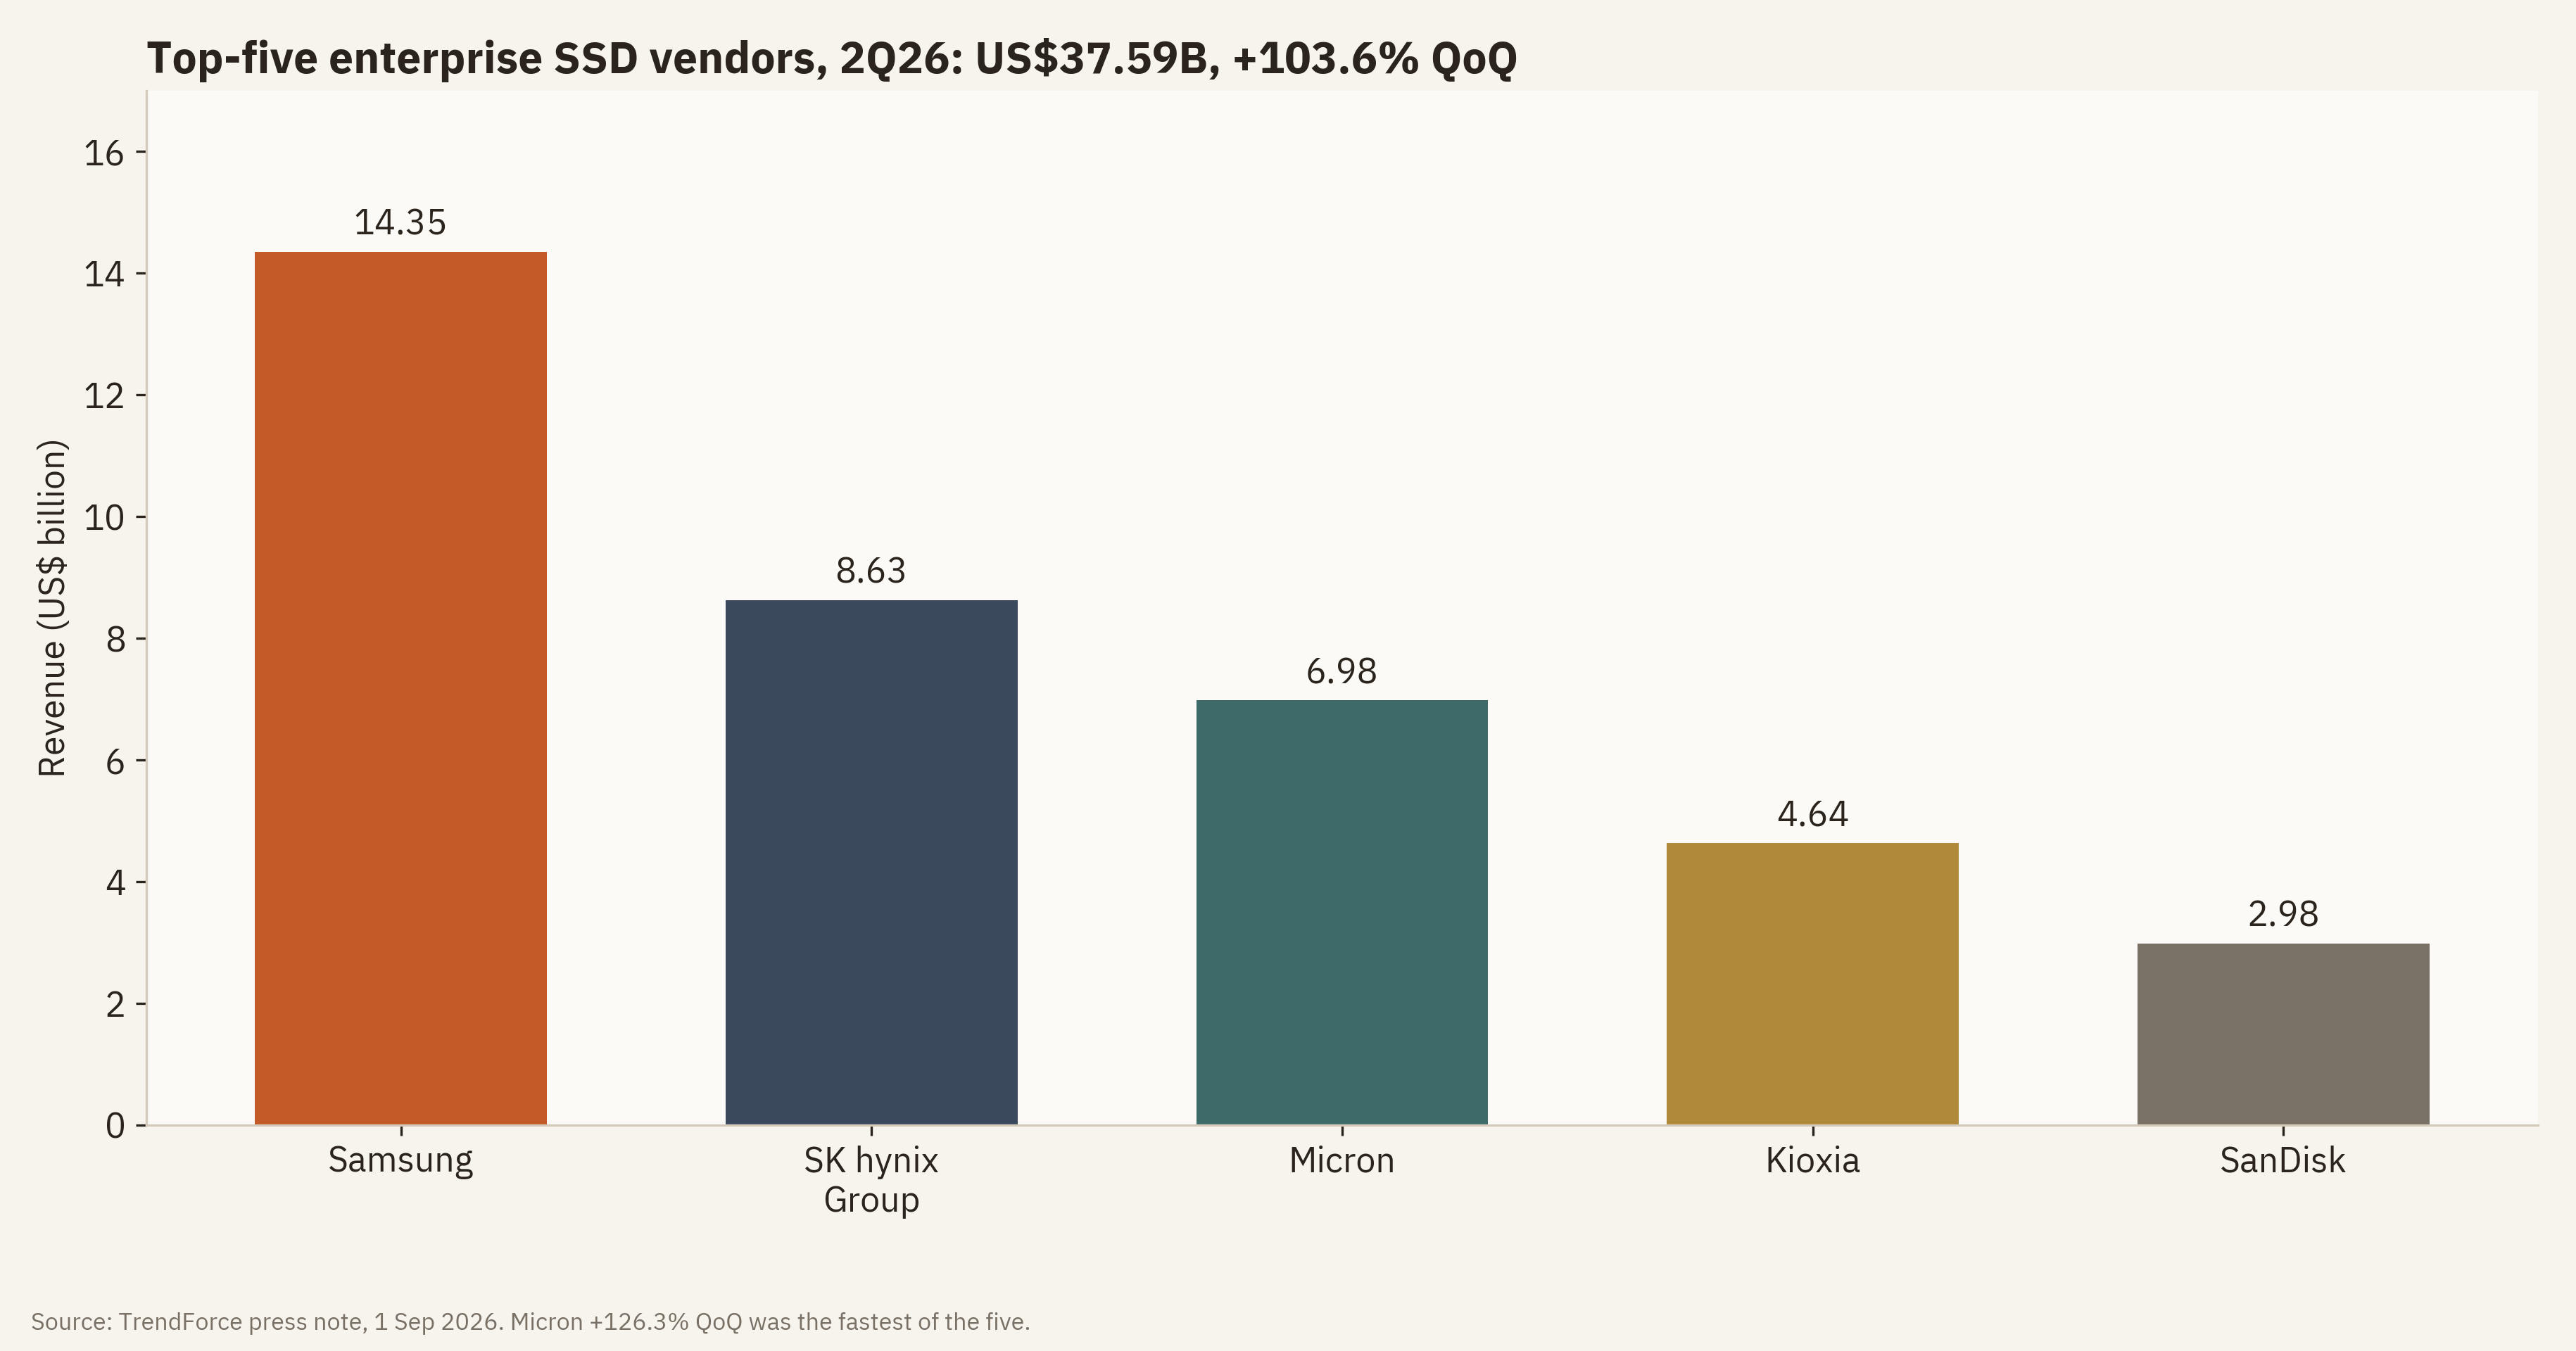
Figure 6. Source: TrendForce, 1 September 2026.
6. Prices, LTA ceilings, and an ambiguous signal
TrendForce’s published contract path is: server DRAM up a cumulative 64 percent in 2H25 and about 270 percent in 2026; enterprise SSD up about 35 percent then 235 percent; HBM contracts possibly up 70–140 percent in 2027. An independent non-TrendForce check sits in Micron’s Form 10-Q for the quarter ended 28 May 2026: DRAM average selling prices rose in the low-260 percent range year on year, while bit shipments rose only in the low-20 percent range. Most of that revenue jump is price, not volume.
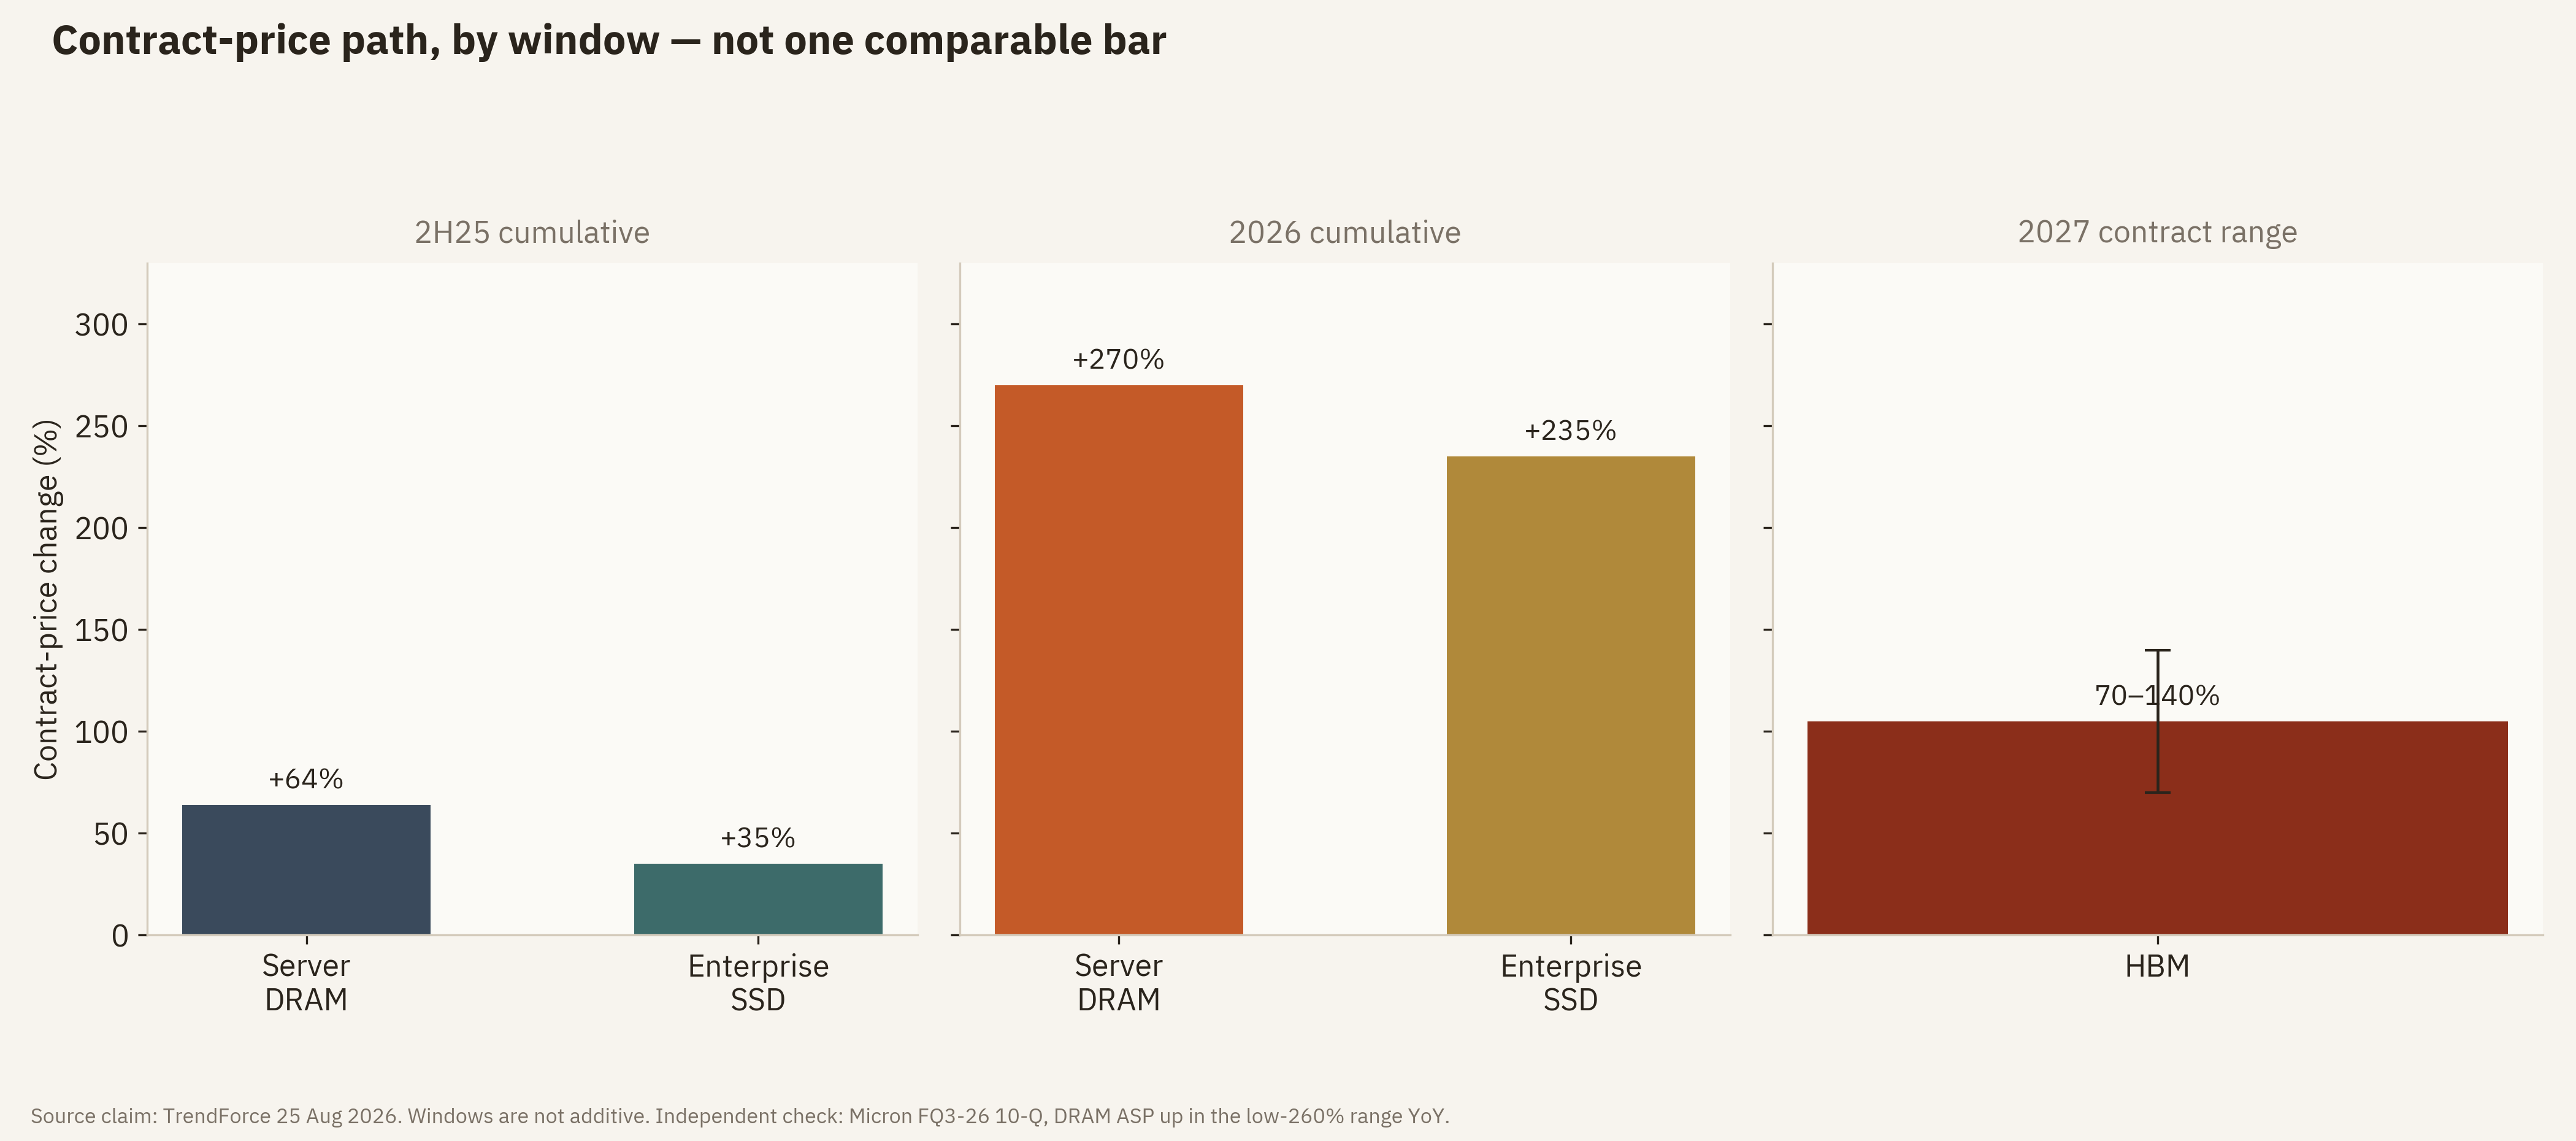
Figure 7. Source claim: TrendForce, 25 August 2026. Three windows, not one comparable bar. 2026 panels are cumulative annual estimates.
From 2Q26, some U.S. CSPs signed multi-year agreements with price ceilings. TrendForce therefore sees 3Q26 server DRAM contracts up 13–18 percent quarter on quarter — still rising, no longer exploding. Price ceilings reduce suppliers’ upside convexity. They are not, by themselves, a peak signal. An LTA can cap price and still deliver volume commitment, allocation certainty, a deposit, a floor, or a multi-year book. The peak-tell reading becomes stronger only if ceilings arrive with weaker floors, thinner volume commitments, or shorter tenors.
Both the “shape of pricing power changed” reading and the “internal 2027 view is softer than the public number” reading remain live. The public TrendForce note confirms the ceilings and the 13–18 percent 3Q26 print. It does not adjudicate the rest of the contract.
7. Four economic layers — and actual P&L
Bit share, wafer share, revenue share and gross profit per wafer do not have to move together. TrendForce reports that in 1Q26, revenue and profitability per wafer for a 64 GB DDR5 RDIMM overtook HBM, because annual HBM contracts did not keep pace with the conventional DRAM spike. That inversion strengthened suppliers’ incentive to reprice HBM4 in 2027 negotiations. The public note confirms the inversion and that 2027 talks moved to HBM4. It does not say the talks “snagged” on that gap.
- Bit share: physical volume. Common trap: makes HBM look smaller than its factory cost.
- Wafer share: pressure on fab capacity. Common trap: treated as if it were revenue.
- Revenue share: price and mix. Common trap: treated as if it were durable profit.
- Gross profit per wafer: supplier value capture. Common trap: least visible in public narrative.
Without supplier P&L, that framework stays theoretical. The verified prints as of 5 September 2026 are listed below as separate observations. They are not one comparable metric.
- SK hynix, 2Q26 calendar: 76% operating margin; revenue KRW 79.32 trillion; operating profit KRW 60.54 trillion. Source: company release, 29 Jul 2026.
- Samsung Device Solutions, 2Q26 calendar: chip-unit operating profit about KRW 89.2 trillion on revenue about KRW 127.5 trillion; operating margin about 70%. Source: company print; Aju Press, 29 Jul 2026.
- Micron, FQ3-26 ended 28 May 2026: GAAP gross margin 84.6%; non-GAAP 84.9%; Cloud Memory GM 83%; Core Data Center GM 87%. Source: Form 8-K / press release, 24 Jun 2026.
- Micron guidance, FQ4-26: revenue about US$50B ±1; gross margin about 86%. Source: same release.
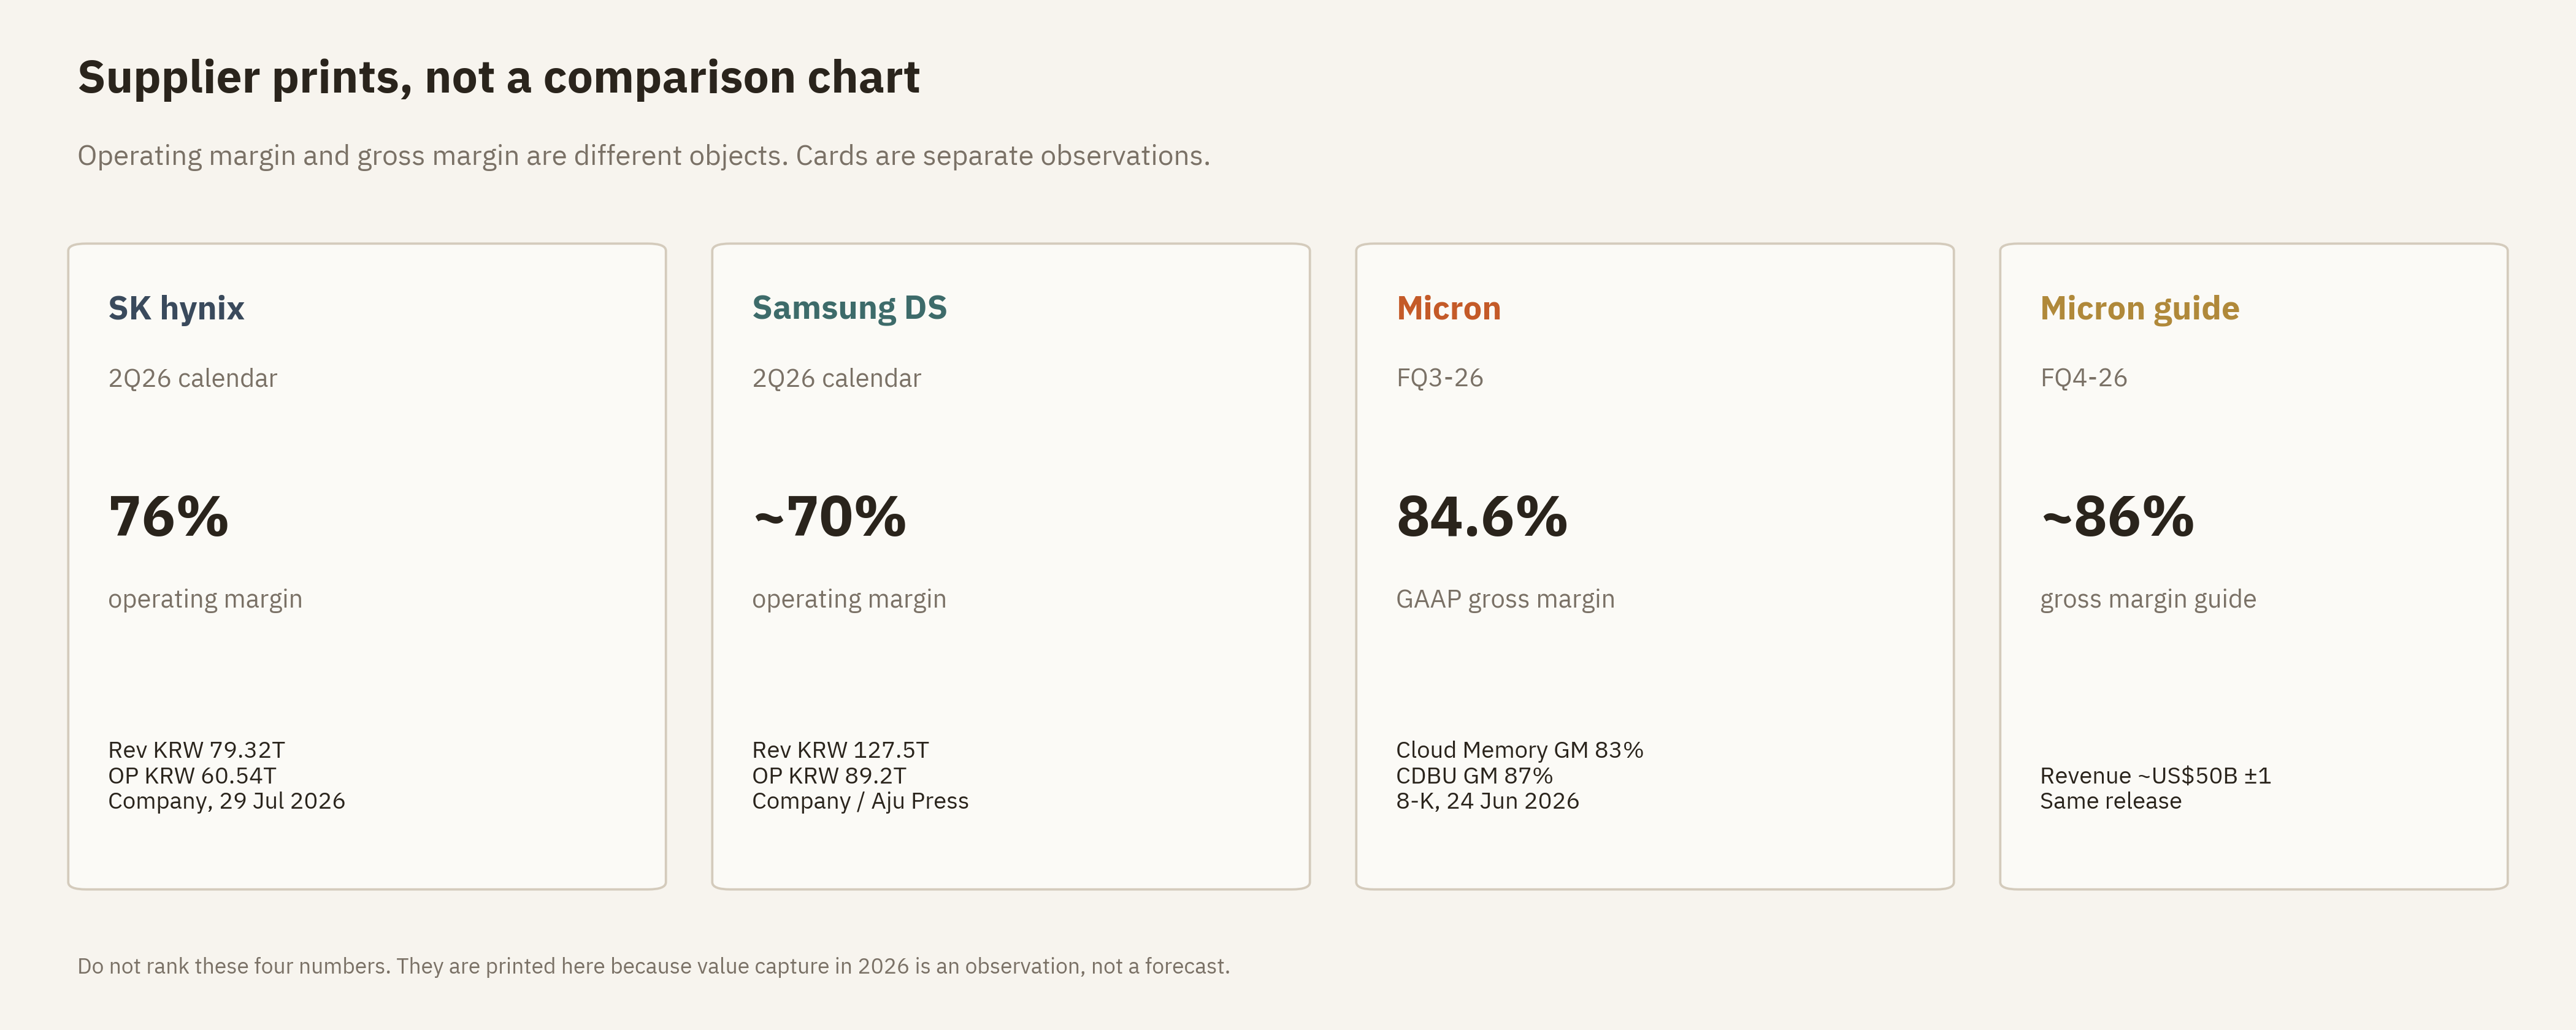
Figure 8. Metric cards, not a ranked bar chart. Operating margin and gross margin are different objects. They show that value capture in 2026 is an observation. Durability into 2028 is still an assumption. Micron’s fiscal fourth quarter is the next scheduled test.
8. Who collects the memory dollar
A larger memory share of AI infrastructure enlarges the addressable pool across HBM, system DRAM and enterprise NAND. That is not a stock ranking.
- Samsung: HBM, server DRAM and enterprise NAND exposure; 2Q26 SSD revenue leader. Broadest product surface; conversion to profit depends on yield and mix.
- SK hynix / Solidigm: strong HBM and server DRAM; second in 2Q26 SSD; 2Q26 HBM revenue share 50% according to Counterpoint. Both ends of the hierarchy; 76% operating margin in 2Q26.
- Micron: strong and expanding HBM; server DRAM; fastest 2Q26 SSD growth; Counterpoint 18% HBM revenue share in 2Q26. Present in all three buckets; FQ4 tests margin durability.
- Kioxia / SanDisk: no HBM and limited server DRAM; fourth and fifth in 2Q26 SSD. Levered to whether flash stays an active inference tier.
For SK hynix, a July 2026 Form 424B4 associated with the group cites IDC at 56.4 percent HBM revenue share in 1Q26. Counterpoint puts 2Q26 at 50 percent, Samsung 33 percent and Micron 18 percent. Those are revenue shares, not bit shares or profit shares.
9. Bull counter-case
The opposing reading of the thesis is that 68 percent is not a denominator problem. It is a path-dependence problem. If 2027 memory dollars equal all of 2026 CSP CapEx, configuration cuts may not be enough and the program itself shrinks. The 2018 memory cycle ran a smaller version of the same loop: high prices, high margins, then demand destruction.
MemoryCapex does not yet have a complete timing model for the shift from redesign to pause. The operational tell used here is two consecutive cuts in CapEx guidance among the four large U.S. CSPs, or a drop in AI-rack orders at Dell and peer OEMs. Until that evidence prints, a program pause is a case, not the base case.
Source-concentration risk is high. Almost the entire contract-price path in this note comes from TrendForce. The independent anchors today are Micron’s 10-Q and SK hynix’s official margin. The next anchors should be those companies’ 3Q26 prints and, if published cleanly, a DRAMeXchange contract series.
Wafer-fab equipment is a second-order read-through only: buyer CapEx becomes memory revenue, memory revenue becomes memory CapEx, memory CapEx becomes equipment demand. That chain belongs in one sentence. It is not a separate investment thesis in this note.
10. Falsifiable dashboard
- DRAM + NAND share of major-CSP CapEx: break threshold: full-year 2026 print below 35%, or a 2027 print above 65% with NAND still tight. Window: each TrendForce update.
- Server DRAM contract: break threshold: negative quarter-on-quarter change in 4Q26 without an inventory explanation. Window: 3Q26–1Q27.
- Enterprise SSD contract: break threshold: decline of more than 15% quarter on quarter before mid-2027 while HBM is still tight. Window: 2H26–2H27.
- Rubin Ultra configuration: break threshold: generation ships at 12-Hi HBM4e with no leaner SKU. Window: NVIDIA or ODM disclosure.
- Supplier margin: break threshold: compression of more than 15 percentage points quarter on quarter at SK hynix or Micron without a mix explanation. Window: 3Q26 and FQ4-26.
- Four-CSP CapEx guidance: break threshold: two consecutive guidance cuts. Window: 2026–2027 earnings.
- LTA structure: break threshold: ceilings with weaker floors, thinner volume, or shorter tenor. Window: 2H26–2027 renewals.
11. Central message
If an AI data center invests one hundred dollars, how many of those dollars reach memory? It depends on what the hundred dollars are, and on what “memory” includes. On a GB200-era full-site build, Bernstein’s public coverage implied about three to four dollars. The same slice after 2026 prices can approach ten dollars. On a Vera Rubin rack, memory plus storage is about thirty-five dollars of the rack and about twenty-four to twenty-five dollars of a modeled one-gigawatt stack. On an AI server hardware BOM, in Google’s wording for high-performance memory, more than seventy-five dollars. On a CSP treasury, in TrendForce’s wording for DRAM plus NAND, forty-seven to sixty-eight dollars.
Those figures describe one market through different denominators and different numerators. The direction is the same. Memory is no longer priced after the GPU is chosen. It now affects how many GPUs can be bought, how a rack is designed, what a token costs, and whether the whole CapEx program can be sustained.
The investment question is therefore not “does memory take more of CapEx?” It is whether a larger dollar pool, slower bit growth and a customer already cutting memory per unit of compute still convert into durable gross profit and free cash flow for the manufacturers. Today’s SK hynix and Micron prints say value capture has begun. The 1.02C identity says the same capture, if it reaches 68 percent of 2027 CSP CapEx, can break the buyer’s program. That print would be a late-cycle warning, not a reason to extend the supplier bull case by another year.
The investment question
Of each new dollar spent on AI infrastructure, how much reaches memory — and how much of that, after price, mix, LTA ceilings and customer redesign, becomes durable gross profit and free cash flow? A realized 68 percent path answers the first half of that question. It does not answer the second.
Sources and method
Confirmed facts in this note are limited to figures that can be tied to a dated primary document or to a named research-house press note. Everything else is labeled as a source claim or as MemoryCapex interpretation. Percentages taken from different denominators and different product scopes are never added or averaged.
- Epoch AI, “Total cost of ownership of a one-gigawatt AI data center,” 14 May 2026.
- SIA and Deloitte, “Powering AI: The Semiconductor Ecosystem at the Foundation of Data Centers,” 1 June 2026.
- Bernstein via Investing.com and November 2025 coverage: foundry / memory / WFE each about 3–4% of GB200-era data-center CapEx, about US$1.0–1.2B per GW.
- Bernstein via mid-2026 coverage: Vera Rubin rack about US$9.1M; memory + storage about US$3.2M (~35% of rack; ~24–25% of a modeled US$47B per GW).
- Deloitte Insights, “Memory chip crunch greater than expected,” 28 July 2026; 30/36 percent cited to SemiAnalysis, April 2026.
- TrendForce, 25 August 2026, 47/68 percent and the contract-price path.
- TrendForce, 4 August 2026, Rubin Ultra configuration review, I/O priority, 50–60 percent HBM bit growth in 2027.
- TrendForce, 30 July 2026, DRAM/NAND divergence in 2027.
- TrendForce, 1 September 2026, enterprise SSD revenue in 2Q26.
- TrendForce, July 2026, 3Q26 server DRAM contracts +13–18% QoQ under LTA ceilings.
- TrendForce / official reprints, 1Q26 HBM wafer-revenue inversion versus 64 GB DDR5 RDIMM.
- SEMICON Taiwan 2026 presentation and Commercial Times / TrendForce News, 1–2 September 2026: Nikhil Cherian; high-performance memory more than 75% of AI server hardware BOM.
- ServeTheHome and Tom’s Hardware coverage of Micron at Hot Chips 2026: approximately 3× wafer area / resources for HBM3E versus DDR5 at equivalent capacity.
- SK hynix Newsroom, 29 July 2026: official 2Q26 results.
- Samsung Electronics 2Q26 results; Device Solutions figures via Aju Press, 29 July 2026.
- Micron Form 8-K and press release, 24 June 2026; Form 10-Q for the quarter ended 28 May 2026.
- Dell Technologies earnings call; Jeff Clarke, 1–2 September 2026.
- Counterpoint Research, 2Q26 HBM revenue share: SK hynix 50%, Samsung 33%, Micron 18%.
- SEC Form 424B4 associated with the SK hynix group, July 2026, IDC 1Q26 HBM revenue share.
#HBM #DRAM #NAND #AIMemory #AIInfrastructure #MemoryPricing #MemoryCycle #EnterpriseSSD #NVIDIA #VeraRubin #Micron #Samsung #SKHynix